 Chrono Mock
How do you know it worked?
With every other tool of this kind, you do not. The application starts, shows some date, and you assume. But it can read the clock through a route nothing intercepted - and then "the test passed" means nothing at all.
The failure that has no symptom
A time-shifting tool that misses a channel does not crash and does not warn. The application simply reads the real date through the one function nobody hooked, and behaves exactly as it would have on any ordinary afternoon. The test goes green. The bug ships.
RunAsDate is honest about this in its own documentation - it says it "will not affect applications that take the current date/time from another source" - and then leaves you to work out whether yours is one of them. This tool treats that same sentence as something to measure.
What a session actually reports
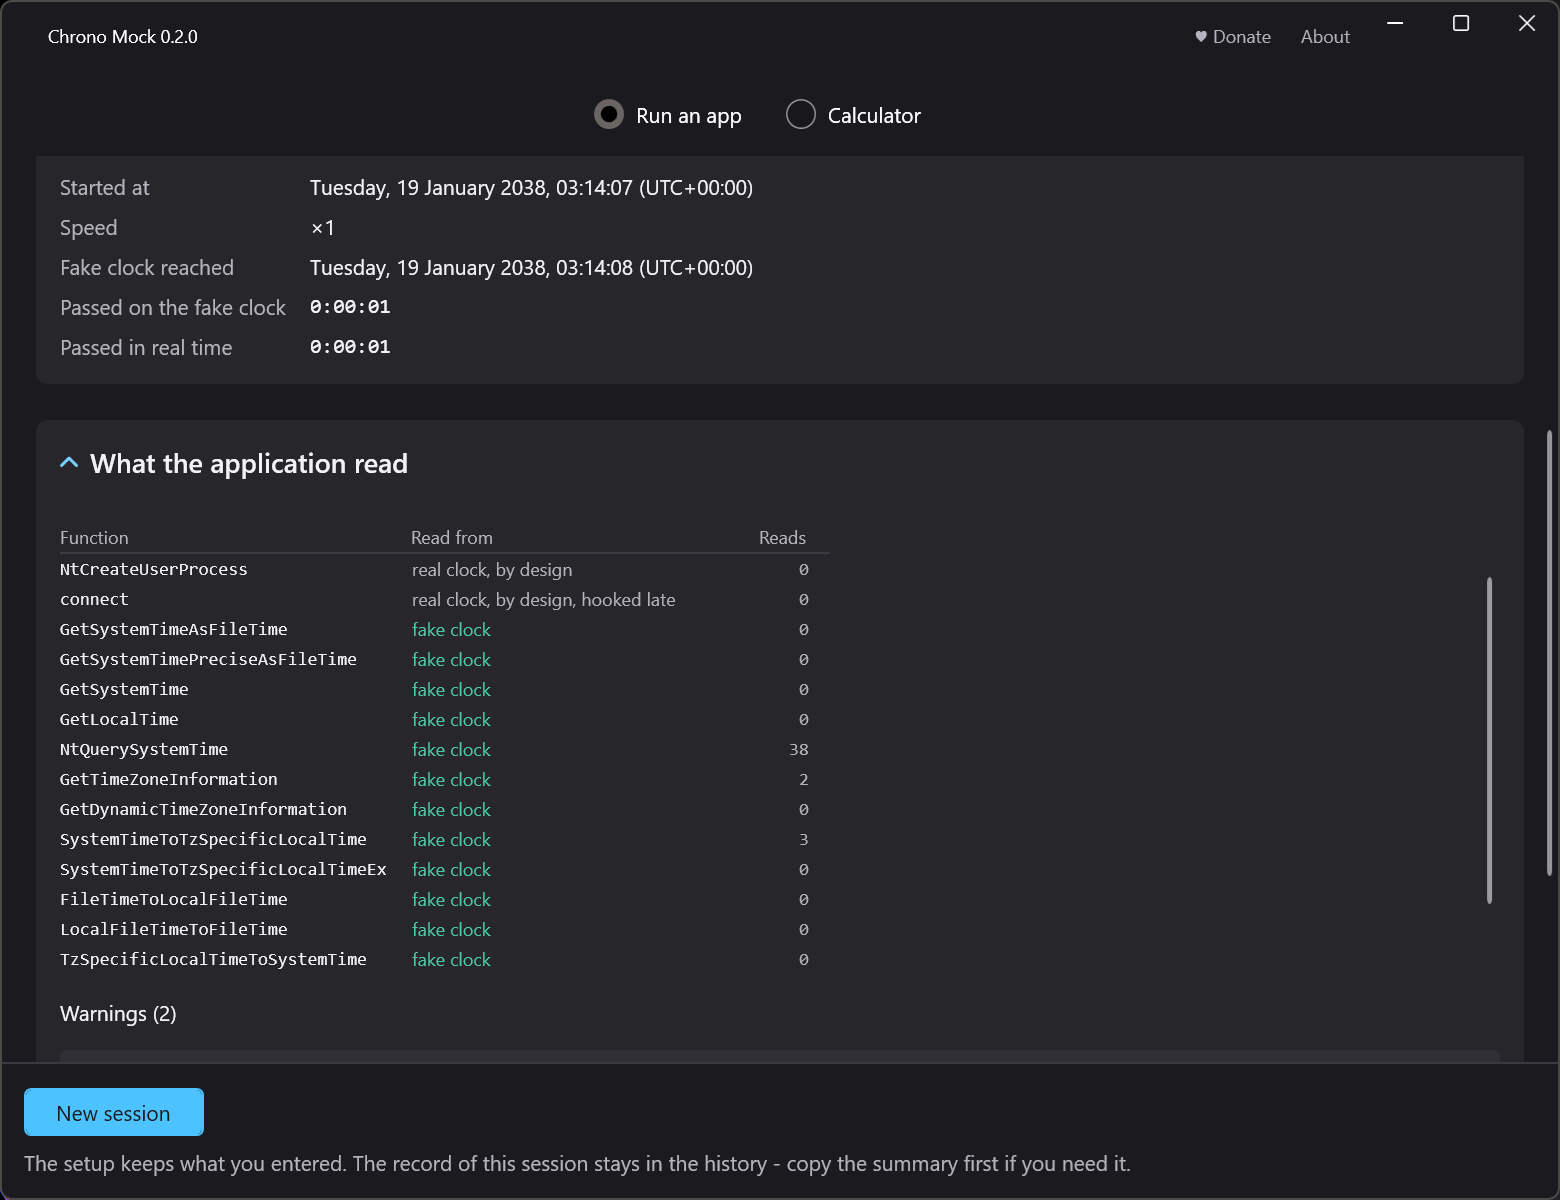
Real output, from running the tool against one of this project's own test probes - one that deliberately opens a network connection:
$ chrono run "...\pnet-x64.exe" --at 2038-01-19T03:14:07 --report session.txt

Chrono Mock - session report
  target:   C:\ChronoMock\tools\probes\bin\pnet-x64.exe
  verdict:  WORKS - time substitution took effect  (processes: 1)
            every process that read time saw the session clock
  session:  fake clock reached 2038-01-19T03:14:10
            real elapsed 3.4s, fake elapsed 3.4s
  exited:   the target closed itself with code 0
  covered channels (substituted, with call counts, 4 calls in all):
            - pid 9152: GetSystemTimeAsFileTime (1 call)
            - pid 9152: NtQuerySystemTime (3 calls)
            ... every other channel, including the ones never called
  observed channels (hooked but left real):
            - pid 9152: NtCreateUserProcess (0 calls)
            - pid 9152: connect (1 call)
  warnings:
            - the target opened a network connection - it may read time from a
              server, which no local hook can cover (source.network_at_start)
  requested:  2038-01-19T03:14:07 (zone +02:00 (host default), mode flow)
The last two blocks are the point. Nothing here failed - the verdict is works - and the report still says, unprompted, that this application talked to the network before it was done, so a local hook may not be the whole story. That sentence is the difference between a test you can trust and one you cannot.
Four verdicts, and an exit code for each
The verdict is reached from inside the running process, before you start working, and it is the tool's own exit code so a pipeline can branch on it.
| Verdict | Exit | Meaning |
|---|---|---|
| works | 0 | every process that read time saw the session clock |
| works partially | 10 | some channels covered, some not - the uncovered ones are listed |
| does not work | 11 | the substitution did not reach the key channels |
| undetermined | 4 | coverage could not be established - an honest "I do not know" |
When the verdict is "does not work", the process is stopped immediately, before you can interact with it. The verdict cannot precede the launch, because the only source of truth is a reading taken from inside the running process. What is guaranteed is that you learn the truth before you start working - not that a doomed launch never happens. You can override and carry on, and the session is then marked unreliable everywhere it appears, including in any evidence you export.
Other codes say that the run itself went wrong rather than the substitution - a usage error, a target that could not be started, a run cut short, another session already running - and none of them is a verdict. The full table is on the command line reference.
Covered, observed, uncovered
Channels fall into three buckets, and the middle one is the interesting one.
- Covered - hooked and substituted. The application asked, and got the session clock. The call count says how many times.
- Observed - hooked, counted, and deliberately left telling the truth. Object waits are here, because shortening a wait's timeout could fake a timeout on a real handle, and the multimedia timer, because scaling it would shift audio and MIDI timing - both watched when the session scales the duration axis. Network connections and one process-creation path are here in every session, because they are evidence, not clocks. The high-resolution counter is not in this bucket: it is left alone unless you ask for it with
--scale-qpc, and then it is covered. - Uncovered - a channel the application read that the substitution did not reach. This is what turns a verdict into works partially, and it is listed by name rather than summarised away.
A count of zero is information too: the channel was hooked and the application never asked. That is why the report lists them rather than hiding them.
What the audit cannot see
The report is honest about coverage, which means being honest about its own edges. These are read without any function call to intercept, or outside the process entirely:
- direct reads of the shared user-mode data page - the value sits in memory, so there is nothing to hook. Rare in ordinary applications, common in licensing and anti-tamper code
- direct system calls that bypass the standard exports - same pattern
- time obtained out of process, through WMI, an out-of-process COM server or RPC
- time from the network - an HTTP
Dateheader, NTP, an API response, or a database server's own clock - time from kernel drivers
The network case is the one the audit can at least notice, which is why the warning in the report above exists. For the rest, a verdict of works means the channels this tool can see were covered - not that no other route exists.
In a pipeline
--json emits the same facts in machine form, --report writes
the human version to a file, and a session whose verdict is anything but
works leads that file with an unreliable-evidence banner rather than burying
it at the bottom.
chrono run "C:\apps\test.exe" --at 2027-12-31T23:59:59 --json --report evidence.txt